The Biggest "Aha" Bar Graph
What It Is
The Biggest Aha Bar Graph allows you to capture what students feel are their most important insights learned and see commonalities among them. Basically, it’s a bar graph constructed using your students’ Biggest Aha Quick-Writes. It allows you to peek into their minds as a group and see what portions of your lesson made the biggest impact on students and what needs further attention. It also provides an opportunity to review the deeper concepts for those students who are still processing the content at a superficial level of understanding.
How It Works
- At the end of your lesson, ask students to think about and record their biggest ahas on a Quick-Write half sheet, index card, or sticky note. (It’s important that all papers be the same size, to make sure that students aren’t using scrap paper or varying sizes of notebook paper.)
- Begin by asking one volunteer to share his or her biggest aha.
- Ask the same student to bring a sheet of paper to a designated area in the room, grab a piece of tape, and tape it to the wall, door, board, bulletin board, or wherever you’d like to have the Biggest Aha Bar Graph posted.
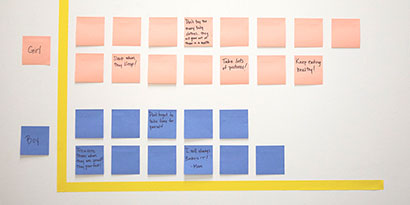
- Ask peers who selected the same or a similar aha to stand up, line up next to the bar graph, and read theirs aloud. After reading it, they should tape it above the other students’ papers, forming the first bar graph column. Occasionally, students will share different ahas that may merit their own column. When this happens, validate their responses and ask them to form a new category by taping it next to (not above) the original response. Go back to the earlier category to finish constructing the column, before moving to the new category.
- Ask a student who has not posted a paper on the graph to share what his or her biggest aha was. Repeat the procedure, by asking students with a similar aha to read theirs and come up and post them.
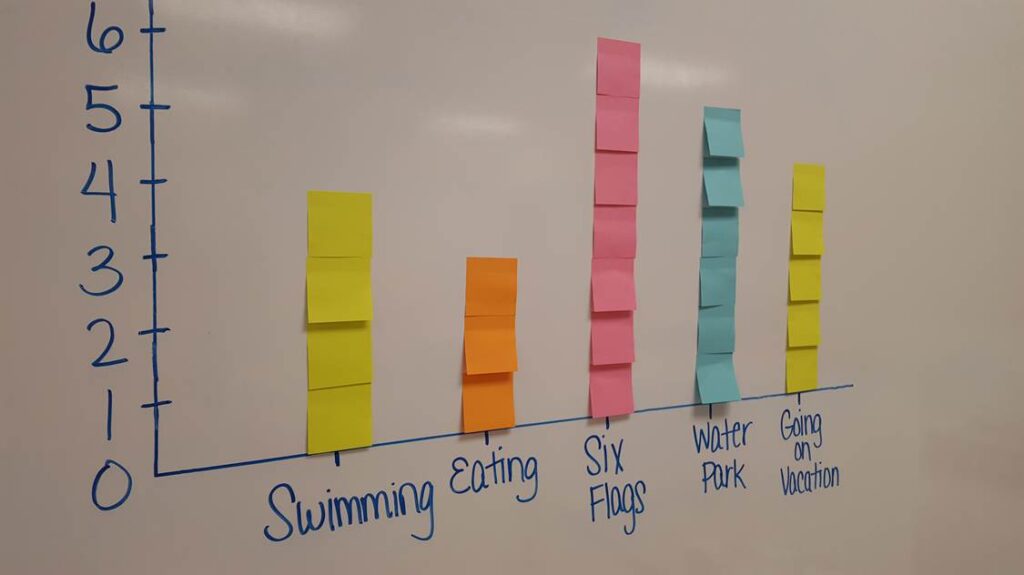
- By the end of this activity, you should have a bar graph made of student comment cards, with each of the categories representing similar comments. You can quickly grasp which concepts made the biggest impact, and you can tell if others need to be revisited. Again, make sure that students write their ahas on the same type or size of paper, so that the bar graph isn’t skewed.
How to Ensure Higher-Order Thinking
This activity is very helpful in gauging for the depth of understanding that students walk away with. Often students will have a very literal understanding of what was taught, and it is clear that they only acquired a surface-level knowledge of the concepts being introduced. This activity helps teachers to know that, so they can continue emphasizing those essential concepts that are important to digging deeper in the lesson. Remind the students to choose a big-picture item, rather than an obscure fact. Highlight those that chose big-picture items by pointing out how they help us as learners to understand the root of the problem, issue, or concept.
Source
Himmele P., and Himmele, W. Total Participation Techniques: Making Every Student an Active Learner. ASCD, 2017, pp.118-120.