Infographics Project
Don’t you love it when someone takes an incredibly confusing topic you need to understand and presents it to you as a striking, clear infographic?
A good infographic can distill a concept so clearly. Take a hugely complex issue and boil it down to a beautiful display of the most important stats, facts, quotations, and images. Creating an infographic is the work of an artist, a writer, a researcher, and a critical thinker.
It is an ideal medium for our students.
What I love about infographics in the classroom is that your project can combine research, carefully edited writing, and visuals with an authentic audience for your students. A good infographic can change a person’s mind about a subject. It can make an argument simply by presenting the facts clearly, effectively, and artistically to pack a powerful punch.
An infographic is basically a combination of a research paper and an argument paper, processed through a visual platform. The addition of images makes it easier for viewers to retain the information they’re trying to learn. Check out this article from Psychology Today for a quick summary of why that’s true, and you’ll have some handy dandy research to back up your arts integration at your school if you’re getting any pushback.
As you approach infographics with your students, talk about modern advertising and the power of visuals in marketing. Maybe open up the New York Times Twitter Graphics feed and talk about how much energy journalists put into visuals and infographics these days.
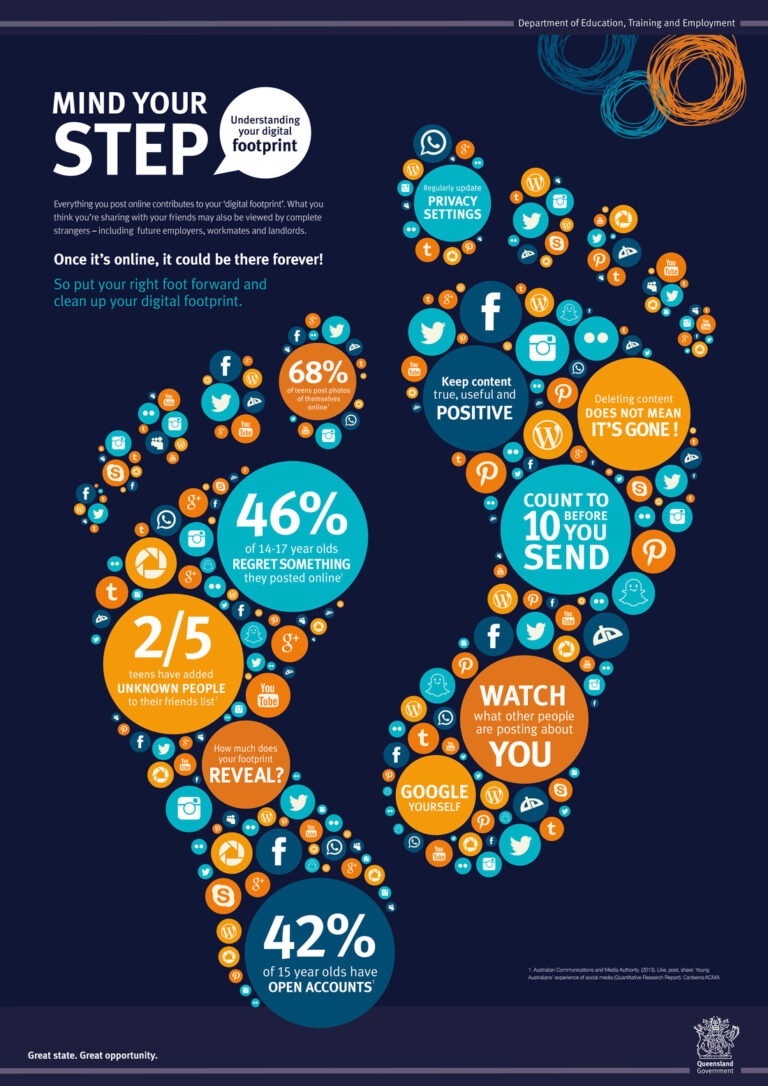
A beautiful infographic sharing fifty ways you can help the environment is likely to get a person thinking about which ones they could easily fit into their lives. A striking infographic showing the effects of unconscious bias is likely to get a reader wondering how their actions are affecting those around them. A stark infographic showing the correlation between social media use in teens and their likelihood to experience depression and isolation is likely to get a student reflecting on their own technology choices.
Potash, Betsy, "Infographics: Research, Writing, and Visuals for the Win." Spark Creativity, 3 September 2019, http://www.nowsparkcreativity.com/2019/ 09/infographics-research-writing-visuals.html.
So when you’re looking for a project that allows students to do real-world work and learn how their research, writing and editing can influence others, an infographic is a solid option. Especially if you let students research and create their infographics on topics they’re passionate about.
Getting Started
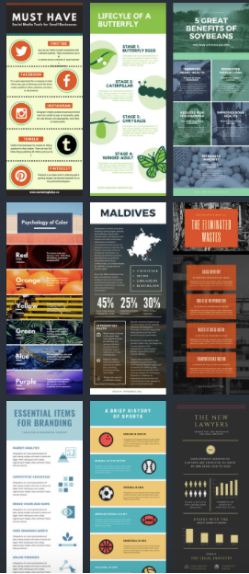
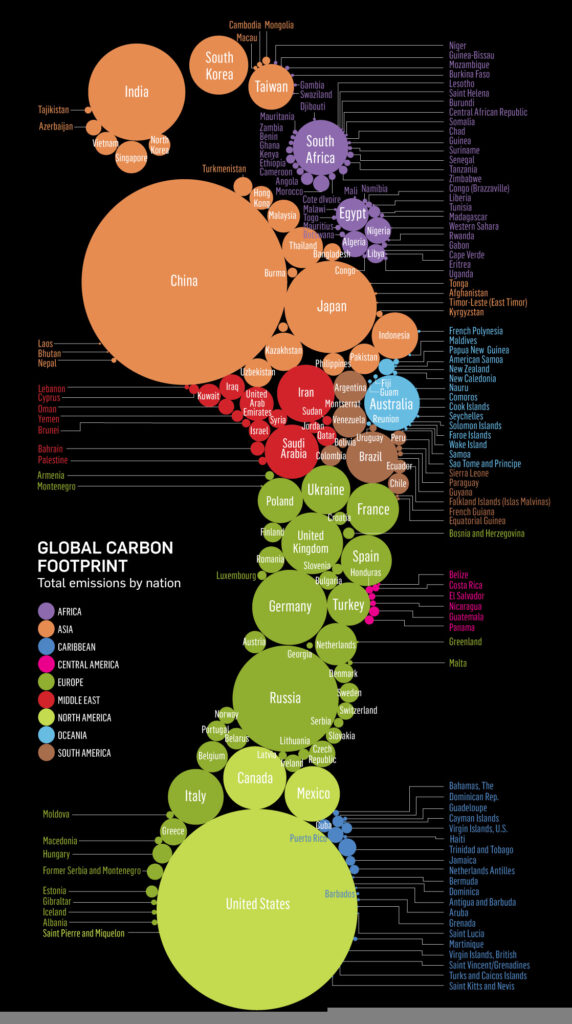
But how to get started? Well, I’d start by showing students what’s going on in the world with infographics. This article shares forty complex pieces well worth examining. Choose several to unpack with the class on a projector, and then let partners dive into one or two more on their own.
Once students have seen what infographics can do, move into a little design thinking. Let students brainstorm issues in the world that they care about, issues they wish they could be change-makers on.
Once they’ve got topics, they need to think about the people they’ll be trying to reach with their information. What do these people know already? What don’t they know? What might surprise them? What kinds of visual imagery might appeal to them?
As they think about how to reach their intended audience, they should also consider how they can eventually share their infographics with them. Can they submit their work to a local paper? Turn it into posters for the library? Send it to the school board? Share it in a Facebook group? Every student should have an intended audience in mind for their work. Their plan for sharing will be a serious motivator in creating quality work.
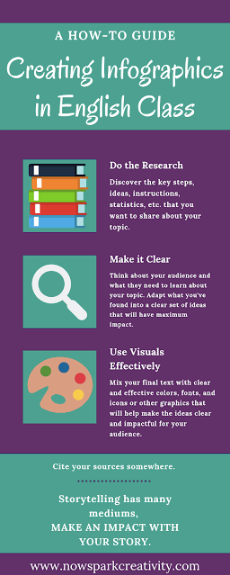
Doing the Research
Next, students need to find sources and information for their infographics. If they’re going to influence people, they need clear facts and statistics they can present to catch people’s attention on their issue. Now’s the time for notecards, graphic organizers (like this fun, free one), or whatever other research tools you like to use with your students.
The Design Game
Now it’s time time to take all that good information and whittle it way, way, down. This is no thousand-word research paper. This is a chance for students to get people’s attention quickly and effectively, and teach those people EXACTLY what they want them to know. As they begin to choose their most important facts and stats, it’s helpful to look at some design options so they can think about how they want to structure their infographics.
Canva has a wonderful free tool for designing infographics. Let students check out the dozens of options there and begin to tinker. They may wish to begin on paper, roughing out their ideas for information and design elements, or they may wish to design through Canva from the get-go. Of course, it also depends on what tech you have available in class. You can always show the templates to give everyone a sense for what’s available, then start kids on paper for the initial drafting. Some very artistic students may even prefer to stick with paper throughout, which is just grand. Others may turn to a program like Photoshop rather than Canva, and that works too.
Things for student to think about when it comes to design:
- Keep it clear, not too busy
- Keep fonts and colors limited to two or three
- Choose one kind of illustration – illustrations, symbols, icons, or photography – for a cleaner look
- Boil your information down to what’s most important
- Cite the names of sources briefly on the infographic somewhere – save full citations to turn in separately
Using Canva
Canva is a fairly intuitive platform, but if you’ve never used it at all, you might consider checking out this post, Canva for the Classroom. It walks you through how to easily design with a template there and adjust fonts and colors. You could also play Canva’s own simple tutorial video for your students in class; it only takes four minutes.
Once your students have begun to combine their information and imagery, you might remind them to think about their audience. What will have a powerful impact? Which facts, stats, and colors/design elements combine to have real influence?
Partner Feedback
This is a good time to get kids together with a partner or a small group to share what they’re trying to do and what they’ve got so far. Let them test out their early prototypes (the return of design thinking!) and get feedback on what’s working well and what’s not working. This could also be a good time for them to look at and discuss some more powerful infographics out in the world (like these) for further inspiration.
Continuing Workshop
Once they’ve gotten some feedback, it’s time to keep working. Give them time in class and out, and trouble shoot with them. If some of your students are stellar artists or designers, having worked in journalism or taken multimedia classes, etc., consider asking them to help mentor the rest, even designing brief five minute lessons they could give to the class during a workshop to share the knowledge they’ve brought with them into class. If some students are ahead of the game, consider letting them present their work on the projector and talk through what they’re doing, both modeling strong examples for their peers and getting feedback so they can take their work to the next level.
Final Production
Once the students have created infographics they’re proud of, it’s time to publish them and share them with the class and their intended audiences. I’d definitely suggest small group presentations of the final projects, having students walk through their processes and intentions for their group members, then share their work with the whole class through a gallery walk.
The Big Finale
Once they’ve presented their work to their classmates, it’s time for the last round of feedback (from you), and potentially some final tweaks before sending it out. It’s a good idea to give students a final nod of approval before they, for example, mail an infographic to your school principal or the city mayor. You want them putting their best foot forward when sharing with their intended audience. Once the work is ready, congratulate your students and cheer them on as they put a toe in the water of influence. Maybe, just maybe, they’ll get a little addicted to the idea that their voice has the potential to make real change in the world.
Looking for complete curriculum for Design Thinking Infographics? You’ll find mine here.